
Analysing Your Website's Performance: Metrics That Matter
Sophie Clarke | 1 October 2024 | 5 mins
Your website is often the first impression customers get of your business; understanding its performance is critical to success. Whether you run an e-commerce store, a portfolio site, or a business blog, analysing the right metrics consistently helps identify areas for improvement, optimising user experience and boosting conversions. But with such a wealth of data available, which metrics really matter?
In this blog, we’ll break down the key website performance metrics to track, providing actionable insights to help you achieve your goals.
Traffic Sources: Where Are Your Visitors Coming From?
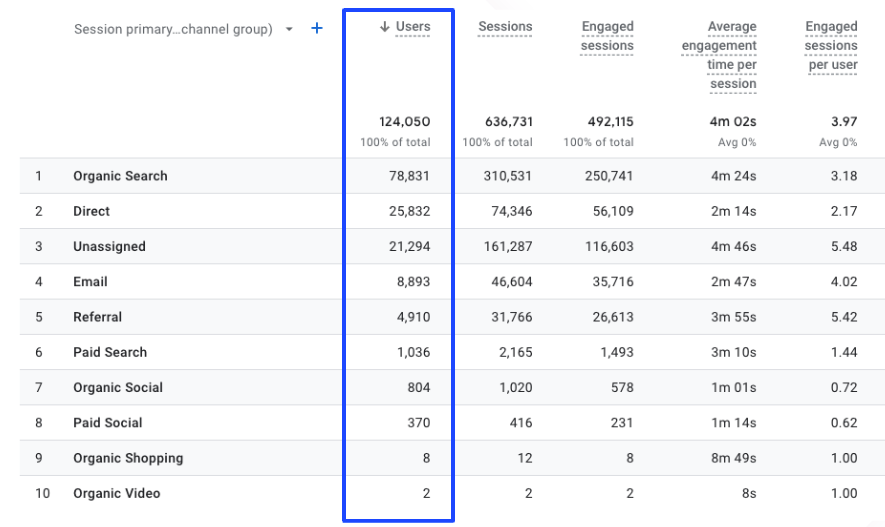
Understanding where your visitors come from is crucial. Are they finding you through search engines, social media, direct visits, or referral links? By analysing traffic sources, you can determine which channels are most effective and where to focus your marketing efforts. For instance, if organic search is your top traffic driver, it’s a clear signal to continue investing in SEO. Conversely, if social media isn't delivering significant traffic, it might be time to reassess your strategy on those platforms.
Conversion Rate: Transforming Visitors into Customers
While traffic metrics are important, the real test of your website's success is how effectively it converts visitors into leads, subscribers, or customers. Your conversion rate measures this, showing whether people take the desired actions once on your site.
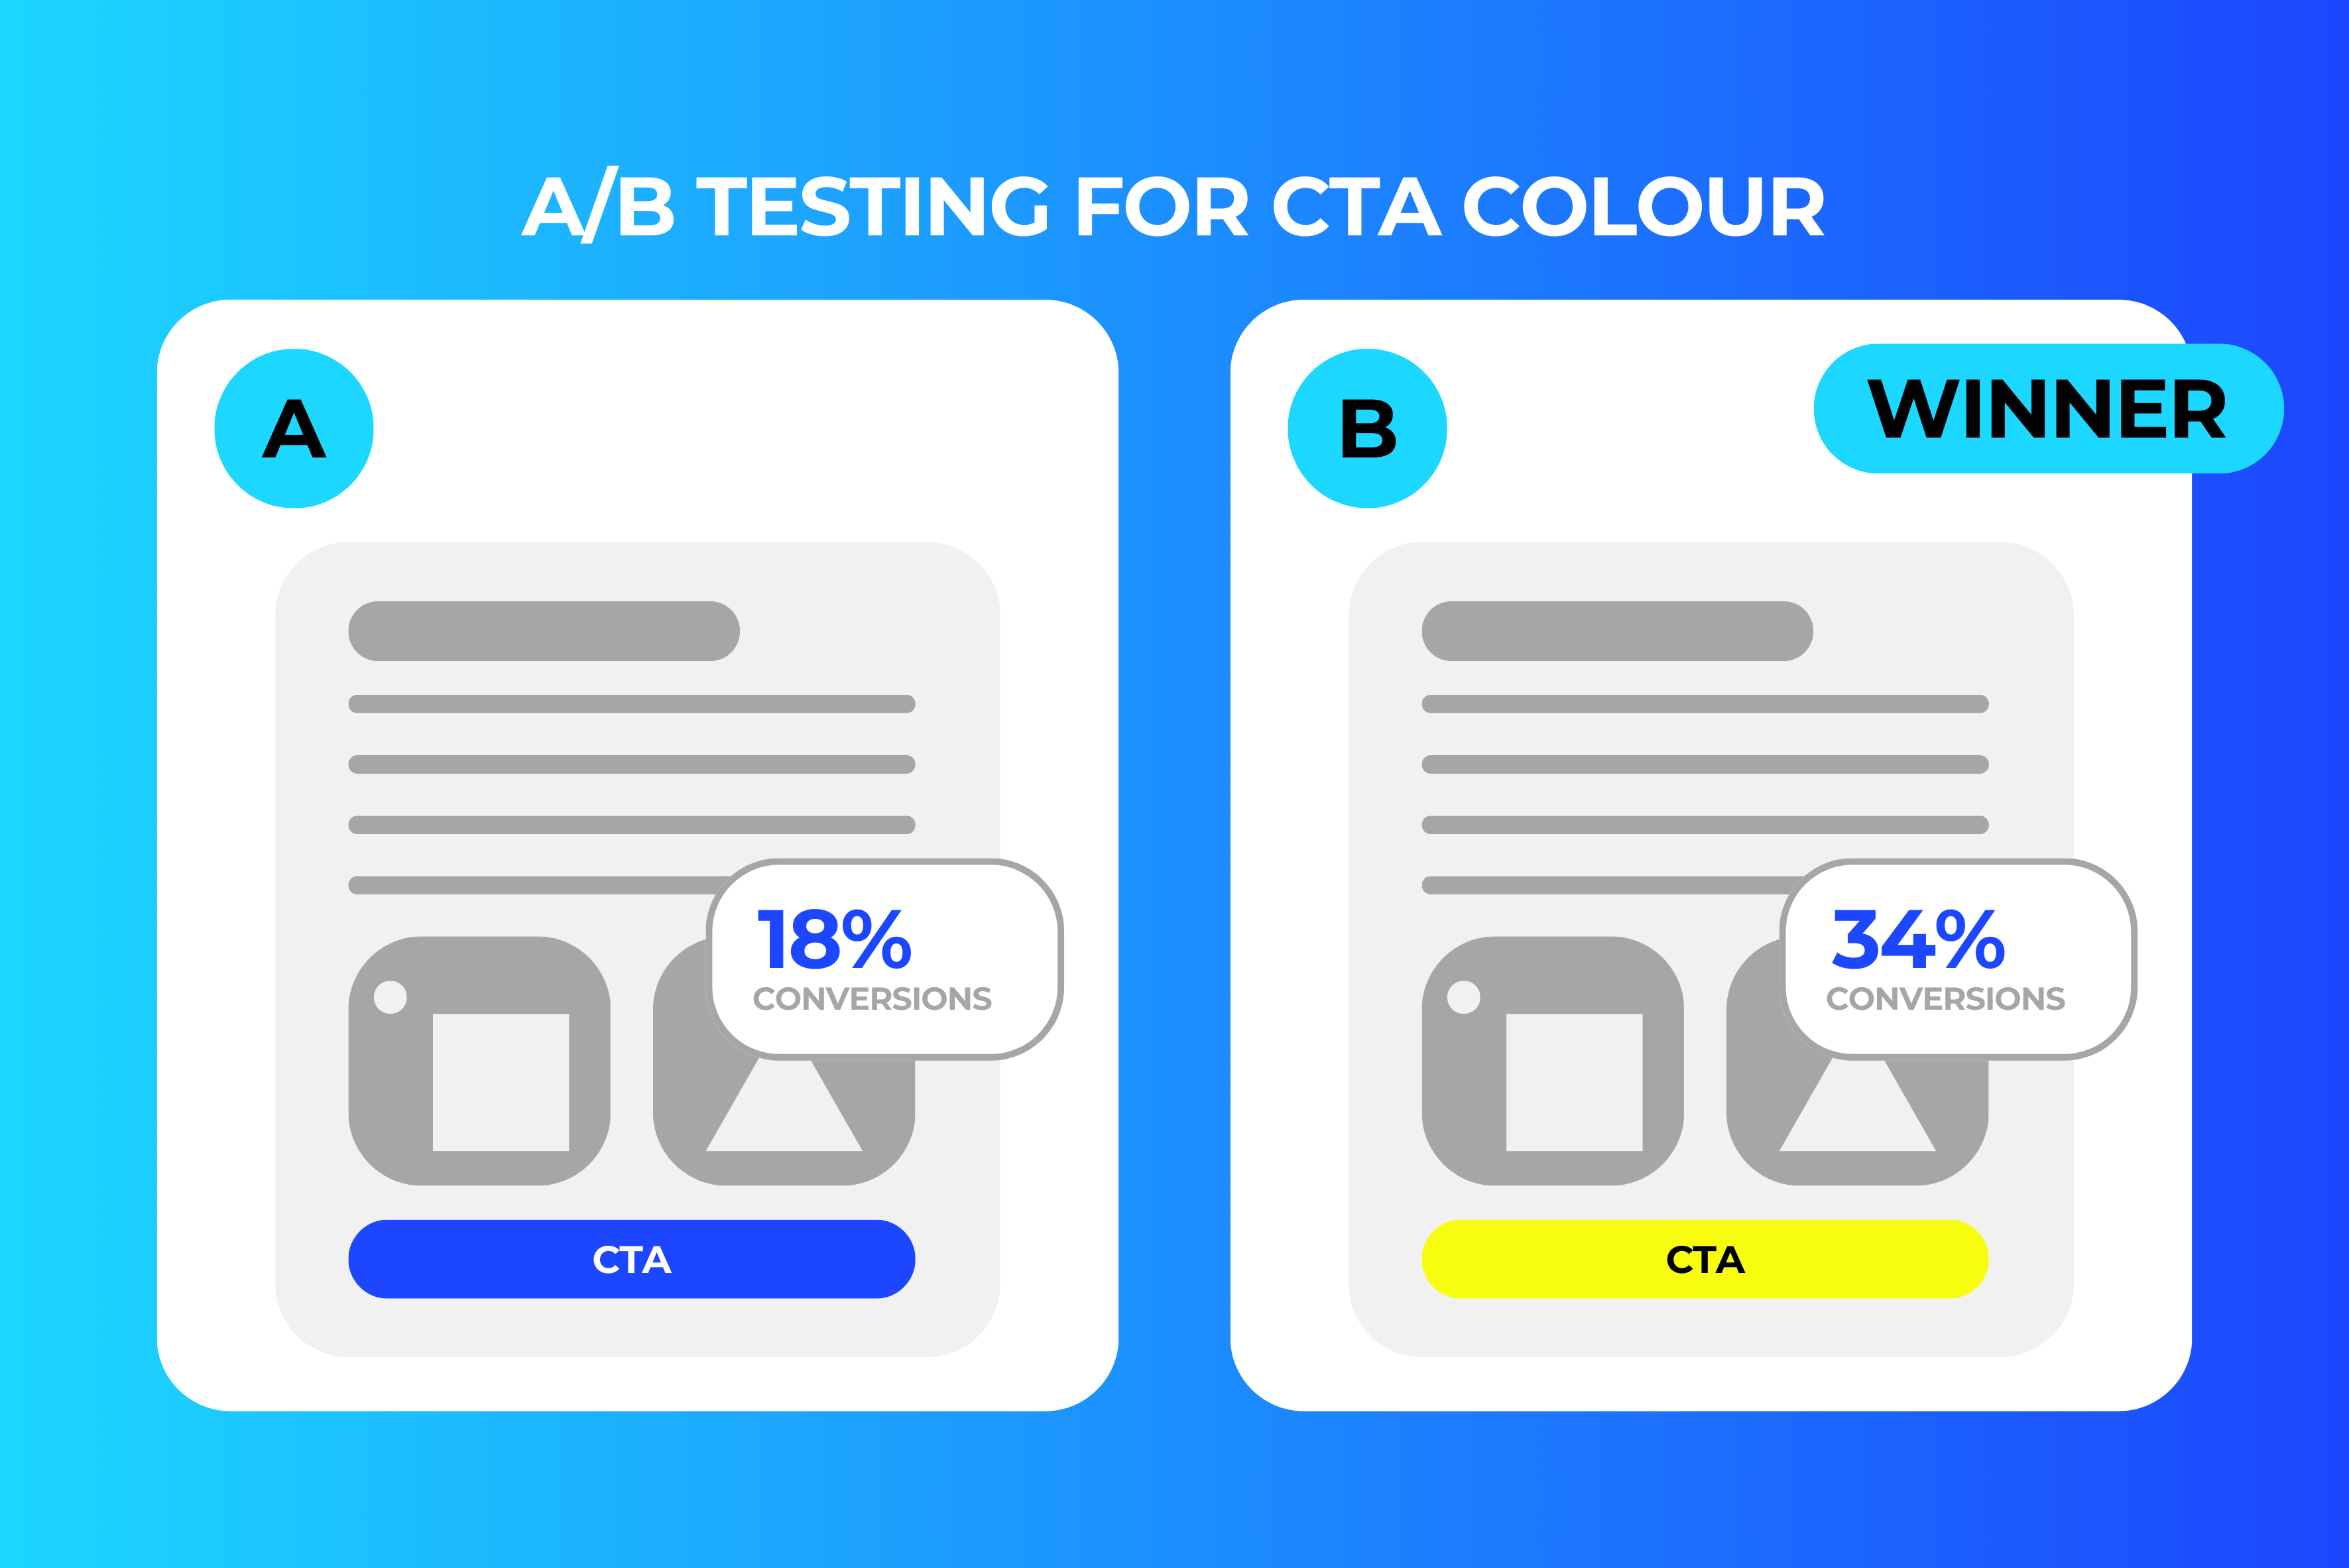
Understanding which pages lead to the most conversions helps in optimising CTAs (calls to action), forms, or checkout processes. A/B testing various elements can lead to significant improvements in your conversion rate.
Average Session Duration: Are Visitors Engaged?
Average session duration shows how much time visitors spend on your website. This metric is a good indicator of engagement—if users are spending more time on your site, they’re likely finding your content valuable. To improve session duration, consider enhancing your content, making your site easier to navigate, and ensuring that pages load quickly.
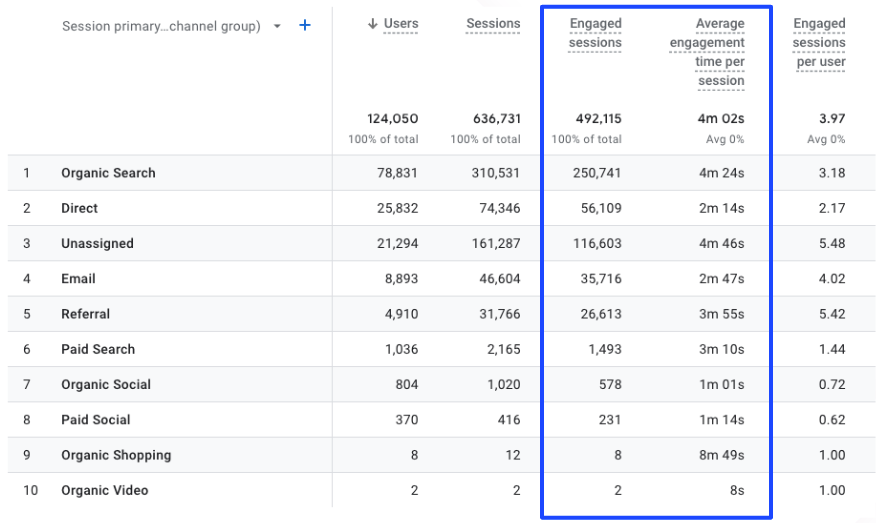
To find this information, you again can use GA4 and head to traffic acquisition but this time, you want to look at the Engaged sessions and the Average engagement time per session. This will give you a clear indication of how people are interacting with your site and also help you to understand if there is a different level of engagement dependent on the entry channel.
Page Load Time: How Fast Is Your Website?
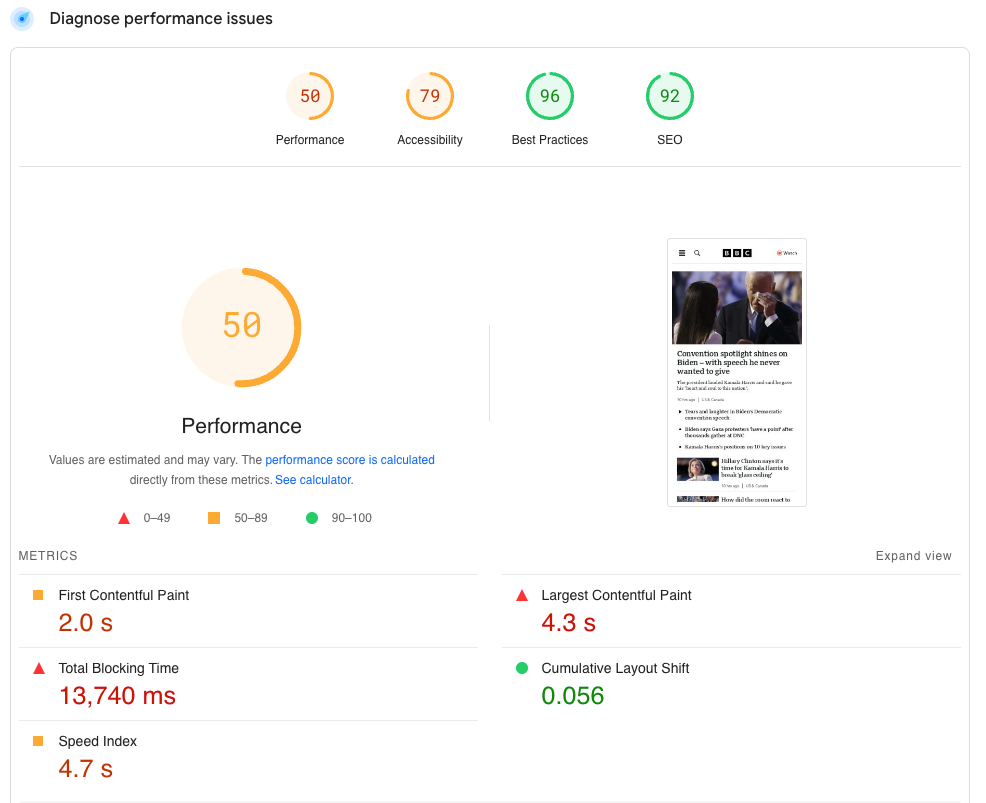
Users expect websites to load quickly. Page load time not only affects user experience but also impacts your search engine rankings. Slow loading times can lead to higher bounce rates and lower conversion rates. Tools like Google PageSpeed Insights can help you identify areas where your site’s performance can be optimised. Faster load times often lead to happier visitors and better overall performance metrics.
It’s important to note that reaching the perfect page speed score is challenging and there are a lot of different things that can impact page speed such as plugins, images, videos, and even the device someone is using can impact page speed. It’s all about striking the right balance between what is needed on your site and how much it impacts page speed, for example, you might need to upload a video to your website but it might be detrimental to your page speed, is there a way that you can reduce the impact it has on page speed such as embedding through YouTube and by using lazy loading.
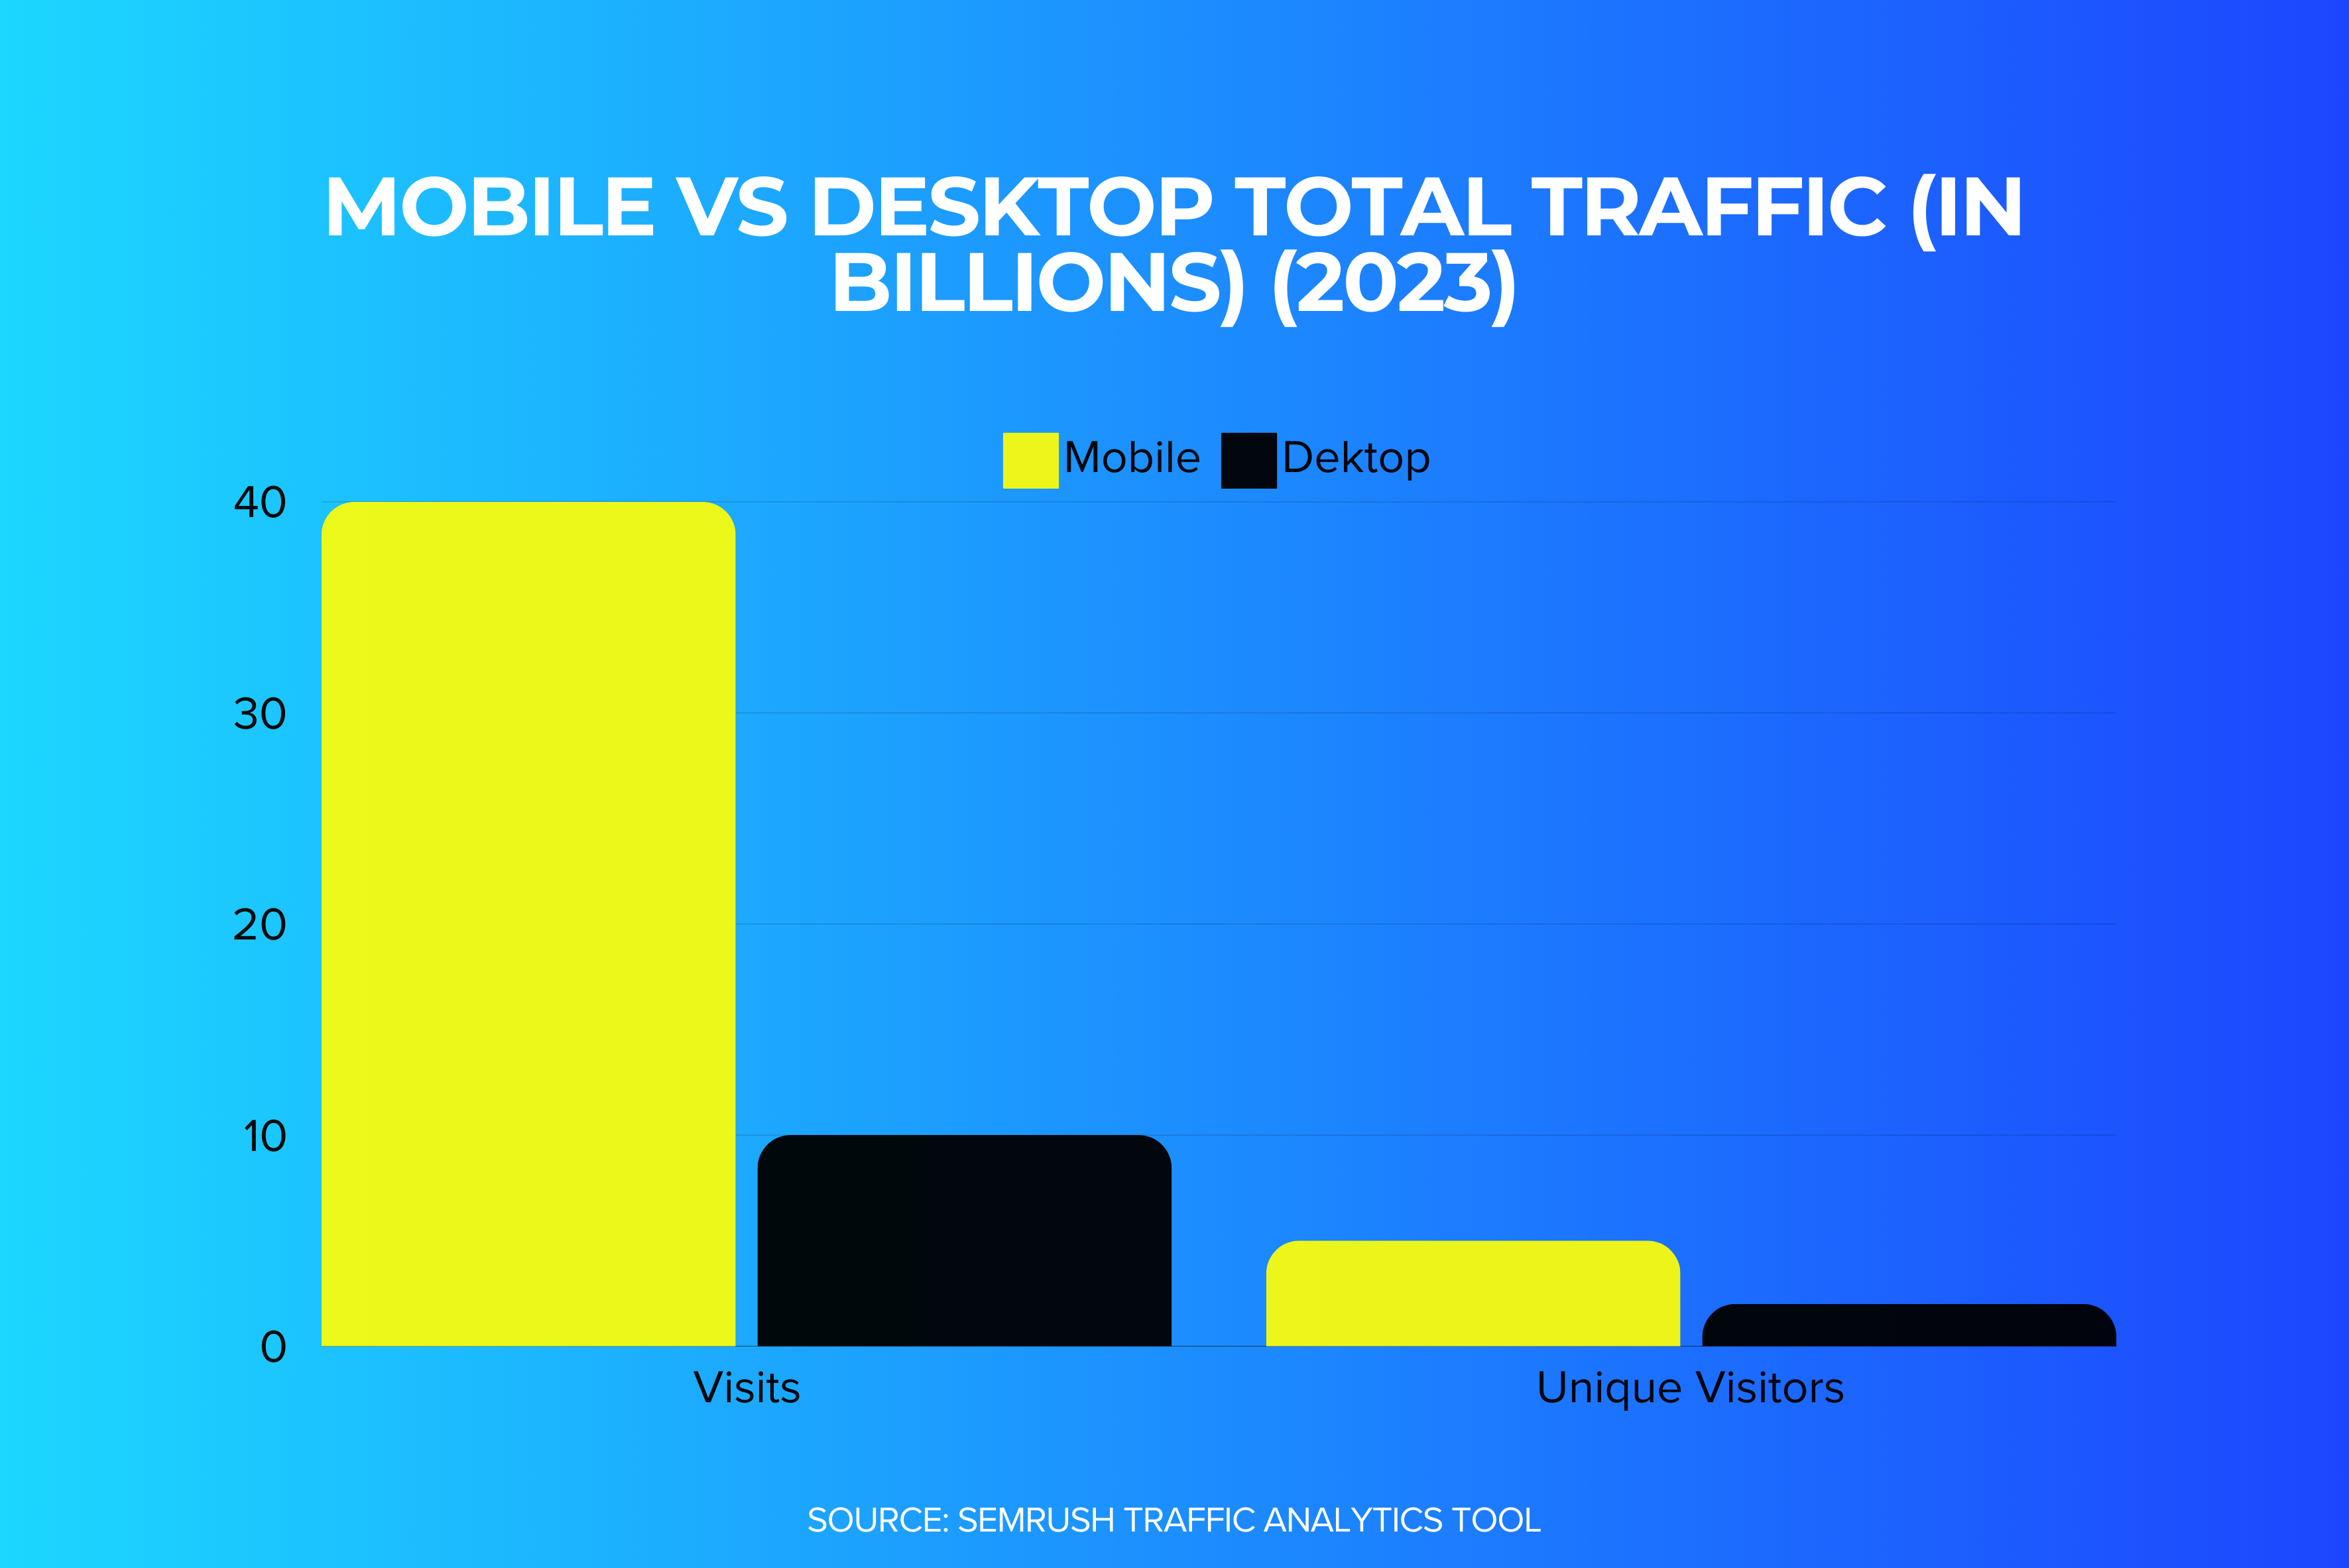
Mobile Responsiveness: Is Your Website Mobile-Friendly?
With mobile browsing now surpassing desktop use, optimising for mobile is essential. Metrics around mobile traffic show how well your site performs on smaller screens, while mobile conversion rates track how many users are taking desired actions.
Issues like poor mobile responsiveness or slow loading times can lead to a poor user experience, resulting in higher bounce rates for mobile visitors. Regular testing across devices ensures a seamless mobile experience.
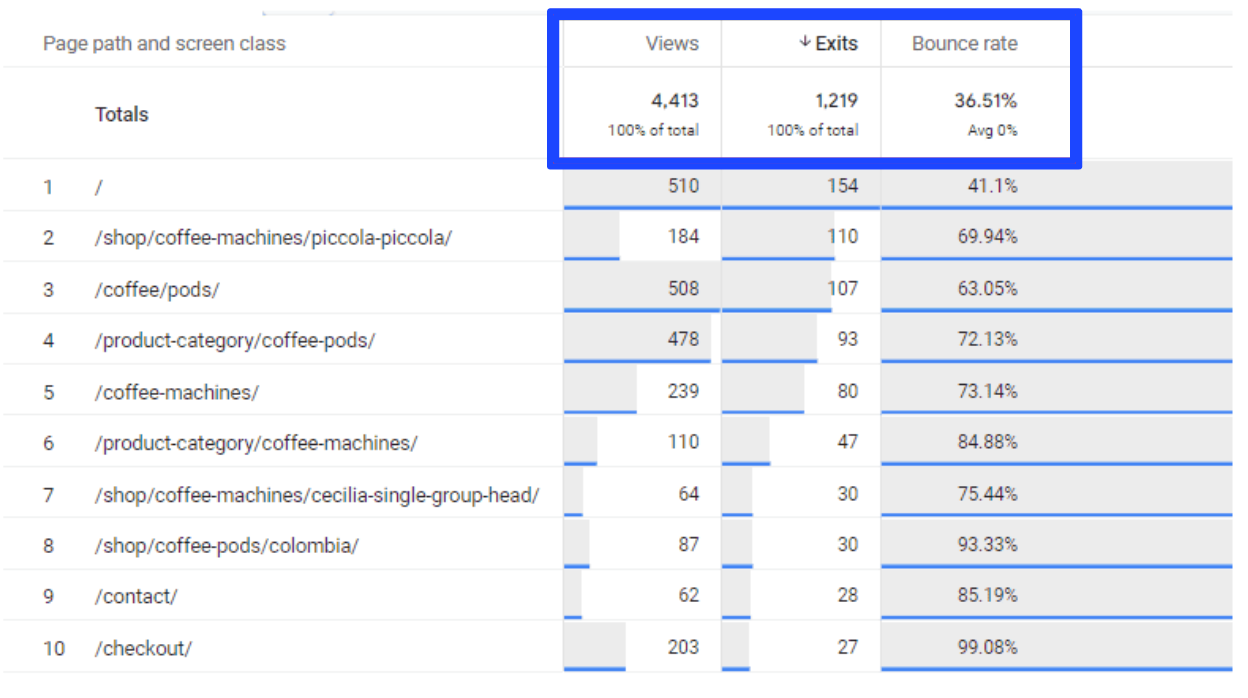
Exit Pages: Where Are Visitors Dropping Off?
While bounce rate shows how many visitors leave after viewing one page, exit rate tells you which specific pages they leave from after interacting with multiple parts of your site. This data helps to understand where visitors disengage and why.
If high exit rates are seen on important pages, such as product listings or checkout, it may highlight issues in the user journey, such as a complex navigation or unclear CTAs.
Focus on What Matters
Regularly monitoring your website’s performance is crucial for its ongoing success. By focusing on key metrics like traffic sources, bounce rate, conversion rate, and load time, you gain insights that allow you to optimise user experience and drive real business results.
Remember, website optimisation is an ongoing process. Measure what matters, make informed adjustments, and watch as your online presence becomes a more powerful tool for growth.
Key Takeaways
Traffic Sources: Identify the most effective marketing channels to focus your efforts.
Conversion Rate: Track how well your site turns visitors into leads or customers. Optimise CTAs and forms to improve this.
Average Session Duration: Measure how engaging your content is; longer sessions usually indicate more value.
Page Load Time: Faster sites perform better in both user experience and search engine rankings.
Mobile Responsiveness: Ensure your site functions seamlessly on mobile devices.
Exit Pages: Analyse where visitors drop off to optimise key parts of the user journey.
Tracking these metrics helps guide improvements and boosts performance.